Dashboard
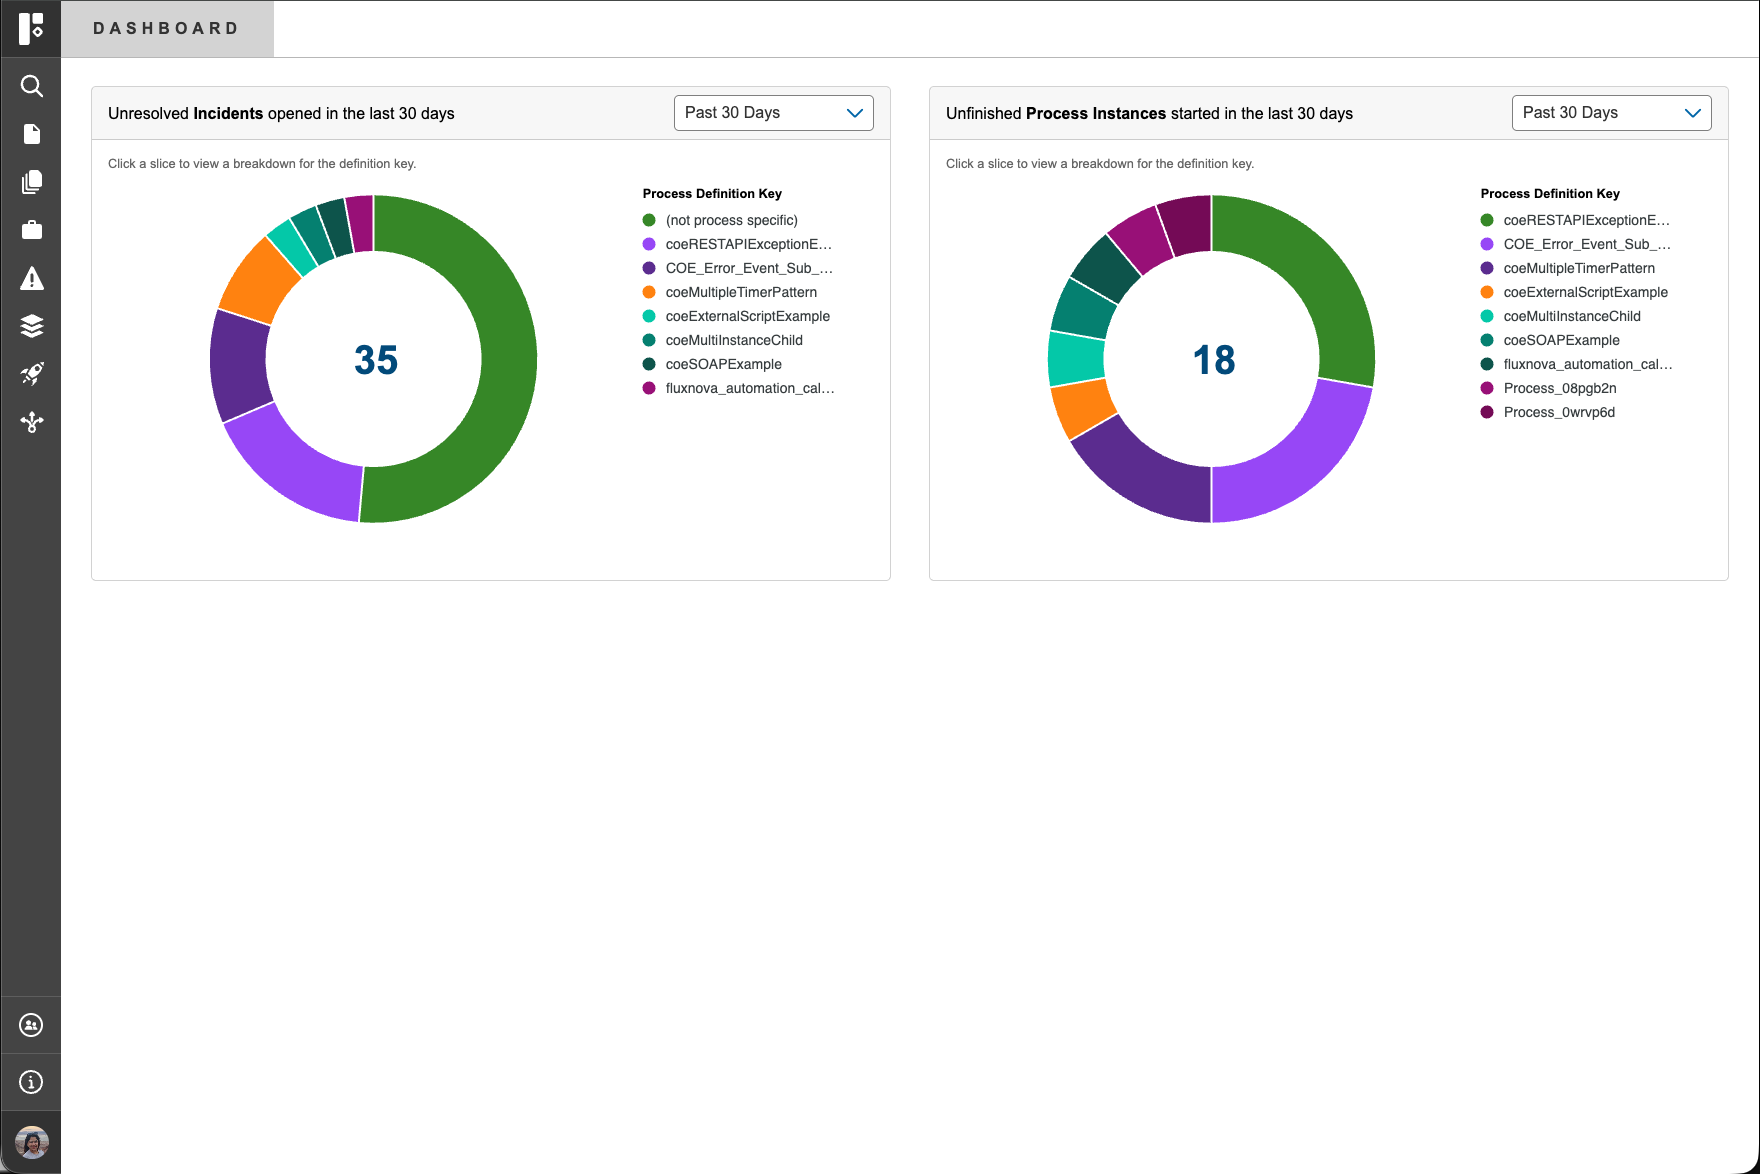
The Dashboard serves as the landing page of Fluxnova Control Center, providing a high-level overview of open incidents and active process instances within the system. It is designed to give users immediate visibility into system health and operational load, enabling quick identification of critical issues and high-volume processes.
Overview
The dashboard visualizes incidents and process instances using interactive pie charts, where data is:
- Aggregated by process definition key
- Sorted in descending order by volume, highlighting the most impacted processes first
At the center of each pie chart, a numeric indicator represents the total number of open incidents or process instances for the selected timeframe.
Interactive Exploration
The dashboard supports drill-down capabilities to help users quickly investigate underlying data:
- Click on a pie chart segment to filter results by a specific process definition
- Click on the center value to navigate directly to the corresponding list view (Incidents or Process Instances)
- Filters applied on the dashboard are preserved in the destination page This allows seamless transition from summary-level insights to detailed operational views.
Timeframe Selection
Users can adjust the reporting window to suit their monitoring needs:
- Supported range: Past 1 hour to Past 90 days
- All visualizations update dynamically based on the selected timeframe
Dashboard Feature Highlight
- Overview of open incidents and process instances
- Data grouped by process definition for contextual insights
- Descending sort order to highlight highest-impact items
- Centralized numeric indicator for total counts
- Drill down navigation to filtered list views
- Adjustable timeframe with dynamic updates