Heatmap
The Heatmap feature provides a visual representation of process execution patterns directly on the BPMN canvas. It helps users quickly identify high traffic areas, bottlenecks, and overall process behavior based on runtime and historic data.
The heatmap overlays execution metrics onto the process model, using color intensity as a visual indicators to highlight quantity and time spent on different activities over a selected timeframe.
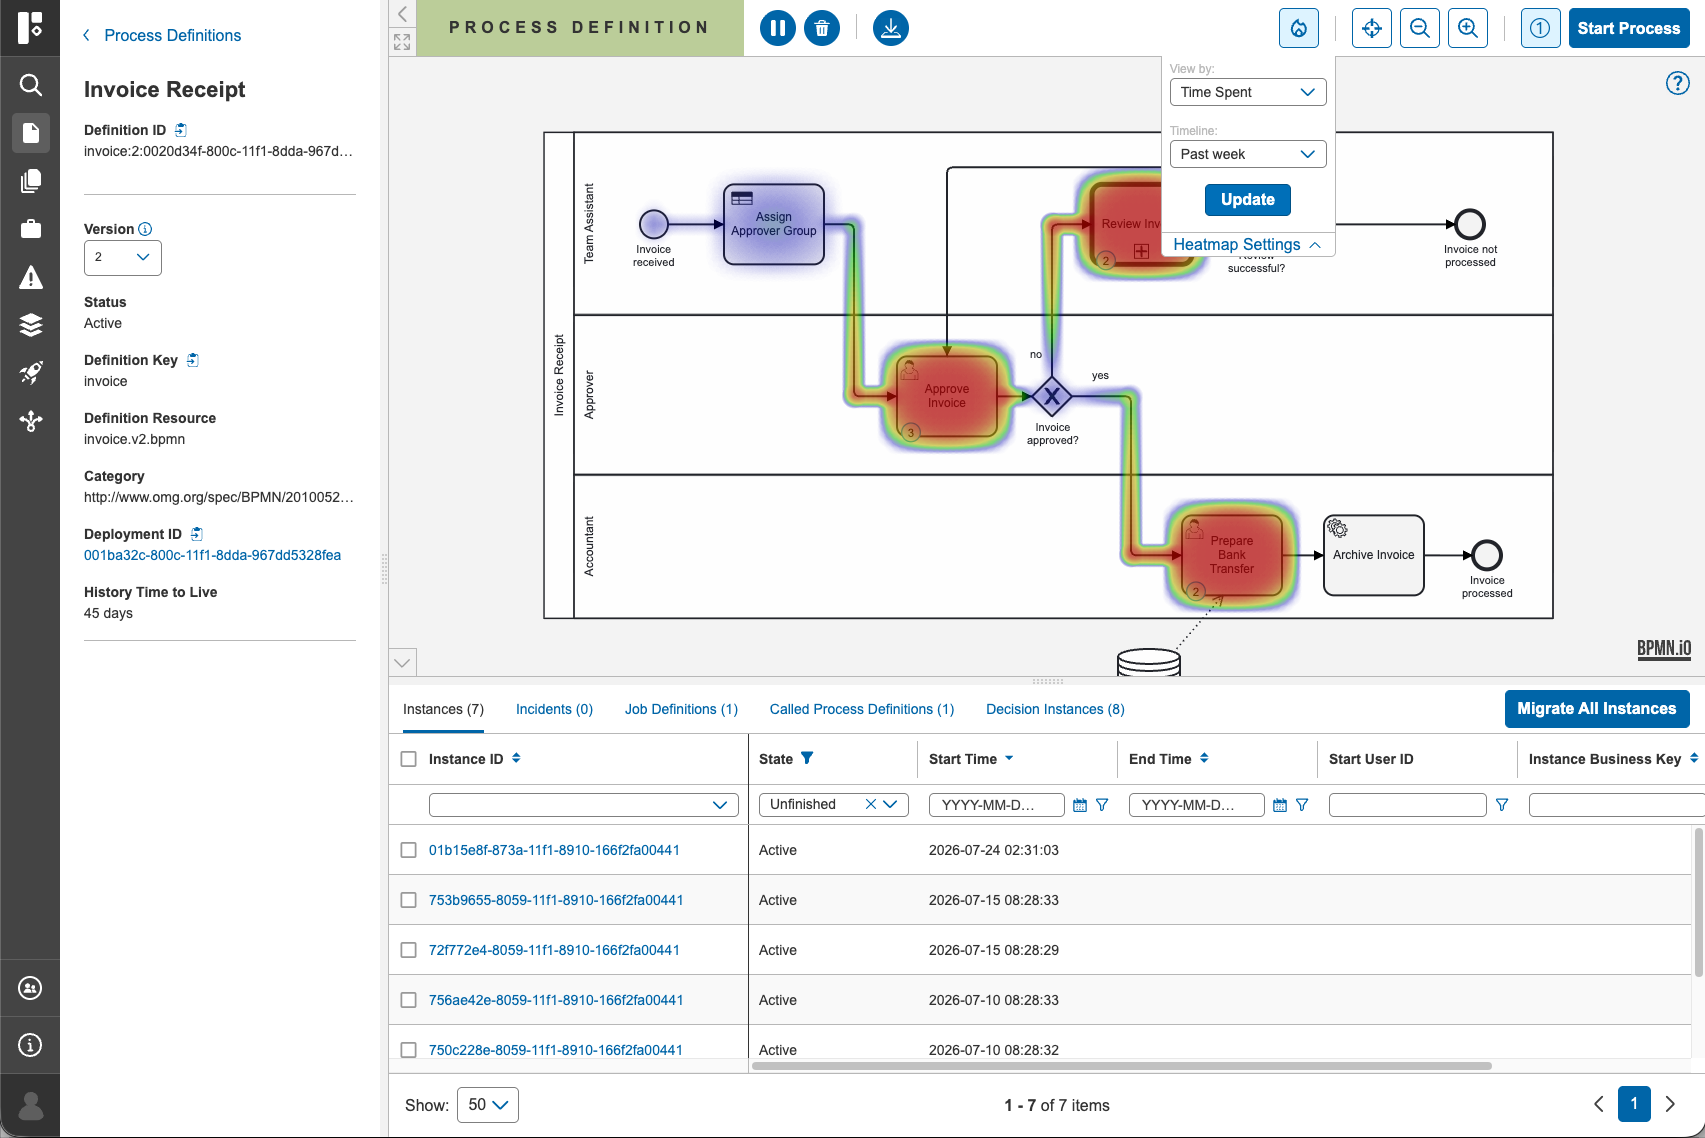
Accessing Heatmap
To view the heatmap:
- Navigate to the Process Definitions list.
- Select a process definition and open its Details View
- Enable the Heatmap visualization from the canvas controls on the top right.
- Once enabled, the BPMN diagram updates dynamically to reflect execution data.
- Modify view by clicking on Heatmap settings dropdown. Settings allow customizing view by quantity or time spent for a selected timeframe.
Interactivity with Canvas
The heatmap works seamlessly with the interactive canvas:
- Selecting an activity still enables filtering of related data in the tabs below
- Users can correlate visual activity levels with Incidents and Jobs Definitions data in the bottom tabs section.
Key Use Cases
Identify bottlenecks
- Detect activities with unusually high load that may be slowing down the process
Analyze process flow
- Understand which paths are most commonly taken in a process
Optimize performance
- Focus improvement efforts on heavily used or problematic areas
Support troubleshooting
- Correlate high activity regions with incidents or delays